 Zyrox
ZyroxHow to Tell If Your CPU Cooler Is Working Well
Spot thermal issues, fan problems, and poor cooler mounting that silently degrade your CPU performance and long-term stability.
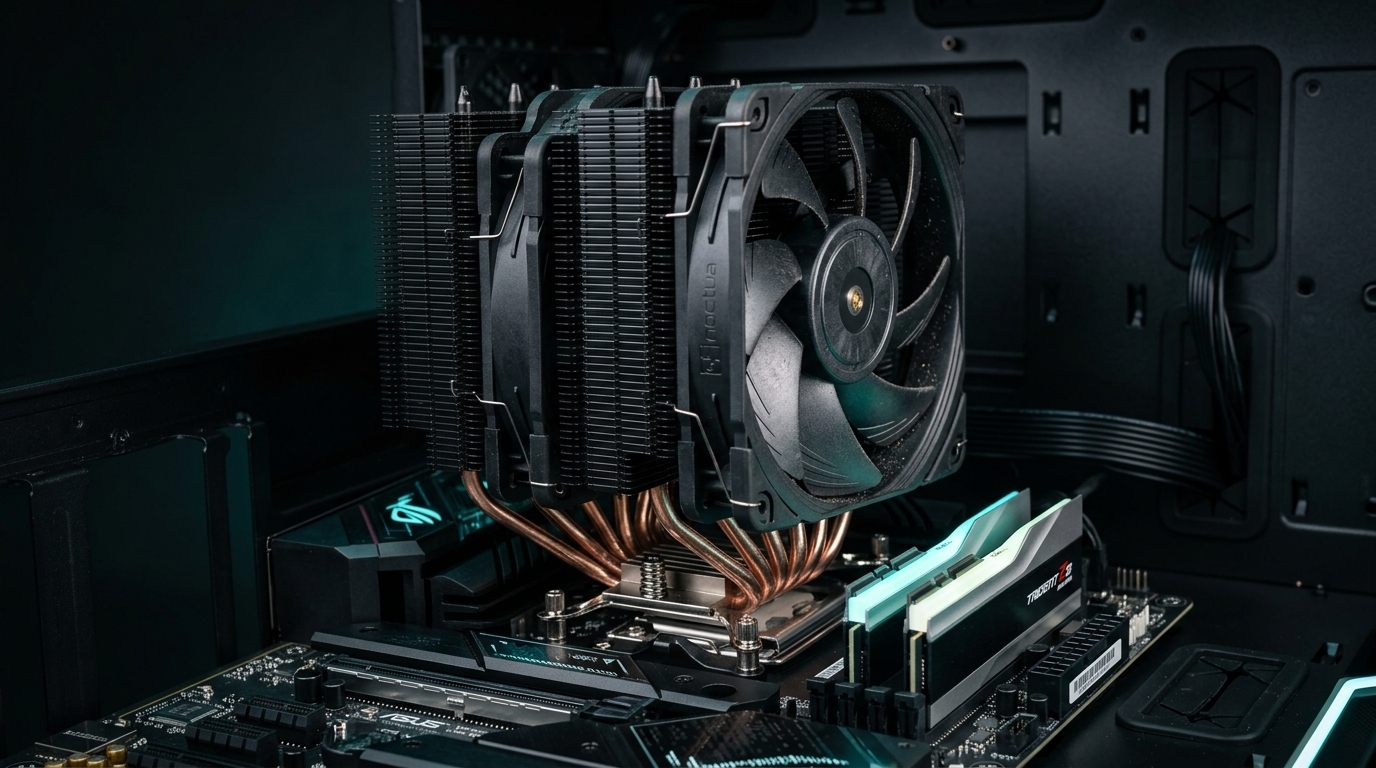 Most people assume their CPU cooler is fine until the system crashes, throttles hard under a benchmark, or starts sounding like a jet engine. By that point, you've already lost stability and potentially degraded your thermal paste faster than necessary. The truth is, a badly mounted or aging cooler shows signs well before any of that — you just need to know where to look.
I've been testing coolers and diagnosing thermal problems across a wide range of builds for years. In this guide I'll walk you through exactly how to evaluate whether your CPU cooler is doing its job properly, using real data and the right tools. No guesswork required.
What "Normal" Actually Looks Like
Before you can say something is wrong, you need to know what right looks like. CPU temperatures vary significantly depending on the chip's architecture, TDP, and your cooler.
For budget and entry-level 65W CPUs like the Ryzen 5 5600, expect idle temperatures between 28–40°C and load temperatures around 60–75°C. Hitting 90°C is the danger zone.
Mid-range chips (65–105W) like the Ryzen 7 7700X run a bit warmer, idling at 35–50°C and hitting 70–85°C under load.
High-end chips (125W–170W) like the Core i9-13900K or Ryzen 9 7950X are designed to run hot. They typically idle at 40–55°C and will push 80–95°C under heavy load, even with high-end air coolers. Pushing past 100°C is where thermal throttling kicks in aggressively. If you put a massive 360mm AIO on these high-end chips, you can usually drop those load temps down to 75–88°C.
Laptop CPUs are their own beast. They idle warm at 40–55°C and regularly operate at 80–95°C under load due to space constraints, only hitting the danger zone around 100°C.
Keep in mind that AMD Ryzen 7000 series chips natively idle warm due to aggressive power management, so seeing 50°C on the desktop is totally normal. Intel 13th and 14th gen chips will purposefully draw maximum power until they hit their thermal limits, meaning they are designed to run incredibly hot under synthetic loads.
Setting Up HWiNFO64 for Proper Monitoring
HWiNFO64 is the most reliable free tool for real-time CPU thermal monitoring. Task Manager doesn't show you enough data, and basic overlays are often misleading.
Download the portable version of HWiNFO64 and launch it in Sensors Only mode. Scroll down to your CPU section, where you'll find three critical metrics. First is the CPU Package temperature, which gives you the overall thermal reading for the entire processor die. Second is Core Max, which shows the highest temperature across any individual core. Third is the CPU VRM (MOS) temperature; if this hits 90°C or higher, your motherboard is struggling to deliver power cleanly, likely due to poor case airflow.
CPU Package temps respond instantly to load spikes, while individual core temps tell you if one specific part of the chip is overheating, which is a classic symptom of a bad cooler mount.
Fan RPM Monitoring: What's Abnormal
In HWiNFO64, check the fan RPM data just below the temperatures. For a quality tower cooler, idle speeds should sit quietly between 400 and 700 RPM. Under moderate load, they'll ramp to 800–1200 RPM. Under a heavy all-core benchmark, expect 1400–1800 RPM — noticeable, but not screaming.
Look out for abnormal patterns. If the RPM reads 0, your fan has failed or isn't plugged into the CPU_FAN header. If it's screaming at 2000 RPM while you're just browsing the web, your BIOS fan curve is broken or your cooler has entirely lost contact with the CPU. Erratically jumping RPMs usually indicate a dying bearing or a loose cable.
If you have an AIO liquid cooler, monitor the pump RPM as well. A healthy pump runs steadily between 2000 and 3200 RPM. If it drops to 0 or fluctuates wildly, the pump is failing, and your CPU will overheat in a matter of seconds under load.
Spotting Thermal Throttle in Real Data
Thermal throttling is your CPU's desperate attempt to save itself by slashing clock speeds. It means your cooler has completely failed to manage the heat output.
You can spot this in HWiNFO64 in three ways. First, watch the CPU Core Clock sensors during a benchmark. If clocks start at 4.8 GHz and suddenly plummet to 3.2 GHz without the workload changing, that's a hard throttle. Second, watch for temperature capping, where the chip hits exactly 95°C (AMD) or 100°C (Intel) and flatlines while performance tanks. Third, HWiNFO64 literally has a "Thermal Throttle" flag column you can enable, which will read "Yes" when throttling occurs.
Identifying Poor Mounting: The Uneven Core Temperature Sign
One of the most reliable signs of a bad cooler mount is a massive variance in individual core temperatures. In HWiNFO64, expand the core temperature list.
Under a heavy multi-core load, cores of the same architecture should cluster within 5°C to 8°C of each other:
- On Intel Hybrid CPUs (12th, 13th, 14th Gen): Make sure you are comparing P-Core to P-Core. It is completely normal for P-Cores to run 15–20°C hotter than low-power E-Cores. But if P-Core 0 is at 74°C while P-Core 4 is cooking at 89°C, that 15°C spread points directly to mounting issues.
- On AMD Ryzen (AM4 / AM5): All full cores should be within 6–8°C. On dual-CCD chips like the 7900X/7950X, CCD0 typically runs 4–6°C warmer than CCD1 due to higher factory boost clocks.
An excessive spread across identical performance cores means the cooler base is not making flat, even contact with the CPU integrated heat spreader (IHS). It is usually caused by unevenly torqued mounting bracket screws, LGA1700 socket ILM bending, or incomplete thermal paste spreading over offset chiplets.
Re-Seat Procedure: What to Do When Temps Are Suspicious
If your cooler is badly mounted, you have to re-seat it. Power down, unplug the PC, and remove the cooler.
Use 90%+ isopropyl alcohol on a lint-free microfiber cloth or coffee filter to completely clean the old thermal paste off both the CPU integrated heat spreader and the cooler base.
Apply fresh thermal paste suited for modern processor geometries: on modern elongated Intel LGA1700/1851 chips and AMD AM5 processors with offset CCD hotspots, avoid an outdated tiny center dot (which leaves corners and chiplet hot spots dry). Instead, apply a 5-dot pattern, an X-pattern, or manually spread a thin, uniform layer with an application spatula.
When remounting, tighten the screws in an alternating cross pattern (top-left, bottom-right, top-right, bottom-left) — turning each screw one or two turns at a time until finger-tight plus a quarter turn. This ensures perfectly even mounting pressure across the silicon.
Thermal Paste Aging: When to Replace It
Thermal paste eventually dries out and loses its conductivity. Most standard compounds degrade significantly after 3 to 5 years.
You'll know it's aging if your average temperatures slowly creep up 5 to 10°C over the course of a year, assuming your room temperature and dust levels haven't changed. When you take the cooler off, aged paste will look dry, cracked, and flaky instead of smooth and viscous. Replacing it every three years is a cheap and effective maintenance habit.
Running a Proper Burn-In Test
Casual gaming rarely pushes a CPU hard enough to expose marginal cooling issues. You need a synthetic stress test.
Run Cinebench R23's multi-core test twice back-to-back while watching HWiNFO64. A good cooler will maintain stable temperatures and consistent scores across both runs.
For maximum stress, run Prime95 on the "Small FFTs" setting for 15 minutes. This generates an absurd amount of heat. If your system survives 15 minutes of Prime95 without crashing or severe thermal throttling, your cooler can handle literally any real-world workload you throw at it. Just remember that modern high-end Intel chips might hit 100°C in Prime95 regardless of your cooler; for those specific chips, Cinebench is a more realistic thermal benchmark.
Related Guides
← Back to home